


State Grant Data
Minnesota's need-based grant program for undergraduates
The Minnesota State Grant Program is the state's largest financial aid program providing need-based grant assistance to Minnesota resident undergraduates attending public and private postsecondary institutions in Minnesota. o During Fiscal Year 2020, the Minnesota State Grant Program awarded $208 million to 77,544 grant recipients. See Minnesota statute and administrative rules governing the program.
Average Combined Federal Pell and Minnesota State Grant Award Received by State Grant Recipients, Fiscal Year 2020
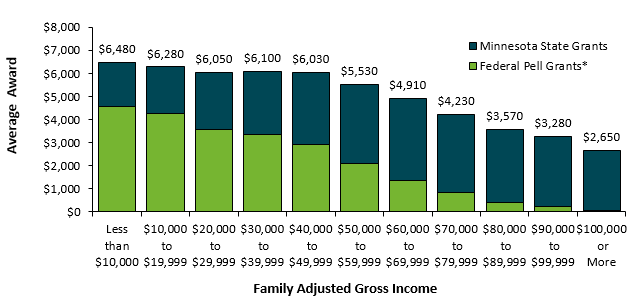
* Includes only Federal Pell Grants received by Minnesota State Grant recipients
Source: Minnesota Office of Higher Education
The Minnesota State Grant Program End-of-Year Statistics report contains the latest annual program data.
The Minnesota State Grant Program Parameters table lists the variables used in calculating Minnesota State Grants for each fiscal year from 1984 through the present.
State Grant and Federal Pell Grant Spending Trends
The Minnesota State Grant columns are the number of Minnesota resident undergraduates receiving a state grant along with the total dollars awarded. The Federal Pell Grant columns are the number of undergraduates attending Minnesota institutions receiving a Pell Grant and total Pell Grant dollars awarded.
Note: The Minnesota State Grant Program received its first state appropriation in 1984. A Minnesota Scholarship program existed is prior years.
| Minnesota State Grant | Federal Pell Grant* | |||
|---|---|---|---|---|
| Fiscal Year | Number of Minnesota State Grant Recipients | Minnesota State Grants (millions) | Number of Federal Pell Grant Recipients | Federal Pell Grants (millions) |
| 1978 | $17.41 | |||
| 1979 | $22.22 | |||
| 1980 | 32,532 | $20.60 | ||
| 1981 | 38,317 | $26.60 | ||
| 1982 | 42,881 | $26.30 | ||
| 1983 | 41,058 | $24.30 | ||
| 1984 | 52,130 | $46.30 | ||
| 1985 | 53,036 | $44.40 | ||
| 1986 | 55,858 | $45.60 | ||
| 1987 | 62,987 | $63.40 | $78.32 | |
| 1988 | 63,229 | $64.60 | ||
| 1989 | 51,569 | $55.60 | $103.98 | |
| 1990 | 46,523 | $54.70 | ||
| 1991 | 59,188 | $71.40 | $109.14 | |
| 1992 | 62,613 | $76.60 | ||
| 1993 | 62,079 | $82.62 | $122.41 | |
| 1994 | 71,801 | $91.00 | ||
| 1995 | 70,565 | $88.60 | $92.96 | |
| 1996 | 63,084 | $88.28 | ||
| 1997 | 61,523 | $89.22 | $89.58 | |
| 1998 | 60,467 | $91.43 | ||
| 1999 | 61,660 | $108.95 | $102.73 | |
| 2000 | 62,802 | $109.54 | 58,185 | $98.20 |
| 2001 | 65,246 | $115.76 | 60,806 | $111.11 |
| 2002 | 71,274 | $125.64 | 67,552 | $138.45 |
| 2003 | 72,396 | $133.59 | 74,917 | $163.10 |
| 2004 | 69,620 | $115.32 | 78,757 | $174.00 |
| 2005 | 73,410 | $124.44 | 80,806 | $177.70 |
| 2006 | 71,108 | $124.29 | 77,317 | $168.69 |
| 2007 | 80,182 | $156.10 | 78,658 | $176.92 |
| 2008 | 83,246 | $148.67 | 89,583 | $214.60 |
| 2009 | 84,518 | $143.52 | 100,329 | $269.19 |
| 2010 | 103,544 | $168.50 | 144,913 | $468.80 |
| 2011 | 88,823 | $119.89 | 181,614 | $606.16 |
| 2012 | 95,510 | $142.73 | 177,385 | $563.84 |
| 2013 | 99,440 | $161.42 | 177,217 | $551.53 |
| 2014 | 99,501 | $172.51 | 161,732 | $526.54 |
| 2015 | 99,324 | $177.03 | 150,639 | $495.28 |
| 2016 | 82,416 | $173.49 | 136,543 | $451.24 |
| 2017 | 81,023 | $187.08 | 124,428 | $407.50 |
| 2018 | 80,793 | $194.02 | 120,700 | $425.05 |
| 2019 | 79,805 | $207.70 | 117,417 | $425.52 |
| 2020 | 77,544 | $207.90 | 114,682 | $417.38 |
*historical data not currently available
Data sources:
Minnesota State Grant Program End-of-Year Statistics
Financial Aid Awarded to Undergraduates Attending Minnesota Institutions
Reports
- State Grant End-of-Year Statistics
- Minnesota State Grant Spending Projections
- Summer Transition Grant Evaluation Reports
- Minnesota State Grant Part-Time Pilots Year 1 Results (2015)
- Minnesota State Grant Review (2008)
Quick Links
- Why College?
- Explore Your Interests & Careers
- Prepare at School
- Summer Academic Enrichment Program
- Earn College Credit in High School
- Recommended High School Classes & Graduation Requirements
- Advice for Students with Disabilities
- Succeed as an Adult Student
- Useful College Prep Resources
- Minnesota Goes to College!
- Get Ready Program Overview
- College Planning Presentation Information
- College Navigator Presentation Request Form
- Minnesota Indian Scholarship Program Outreach
- Competitive Grant Programs
- Dual Training Grant
- Public Engagement Calls
- "Life After Now" Podcast
- Certified Nursing Assistant Training
- Direct Admissions Minnesota
- Collecting Data from Minnesota Postsecondary Institutions
- Campus Financial Aid Administrator Resources
- Statewide Financial Aid Conference
- Campus Student Enrollment Reporting Resources
- Ordering Materials for Your Students
- Supplementing Your College Counseling
- Early Awareness Efforts
- Student Homelessness in Higher Education Resources
- Shared Library Resources
- MN FAFSA Tracker
- Campus Sexual Violence Prevention and Response
- Statewide FAFSA Filing Goal
- Financial Aid Estimator
- Online Applications
- About Financial Aid
- What Does College Cost?
- Tips for Lowering the Cost of Higher Education
- Institutional Payments
- Financial Aid You Don't Repay
- Financial Aid You Must Repay (Student Loans)
- Financial Aid You Earn
- Military Service Education Benefits
- Reduced Out-of-State Tuition Options
- Education Tax Benefits
- New Video Demystifies Paying for College
- Public Service Loan Forgiveness
- Useful Online Resources
- Ready, Set, FAFSA!
- Data Maps and Infographics
- Educational Attainment Goal 2025
- Minnesota Measures
- Minnesota P-20 Statewide Longitudinal Education Data System
- College Readiness & Participation Data
- Student Enrollment Data
- Degrees, Graduation Rates, Attainment & Outcomes
- Financial Aid Data & Trends
- Tuition & Fees Data
- Student Health and Safety
- Institution and Data Search
- Transfer Students
- Research Reports
- A-Z Data Table Index