


Financial Aid Awarded to Undergraduates Attending Minnesota Institutions
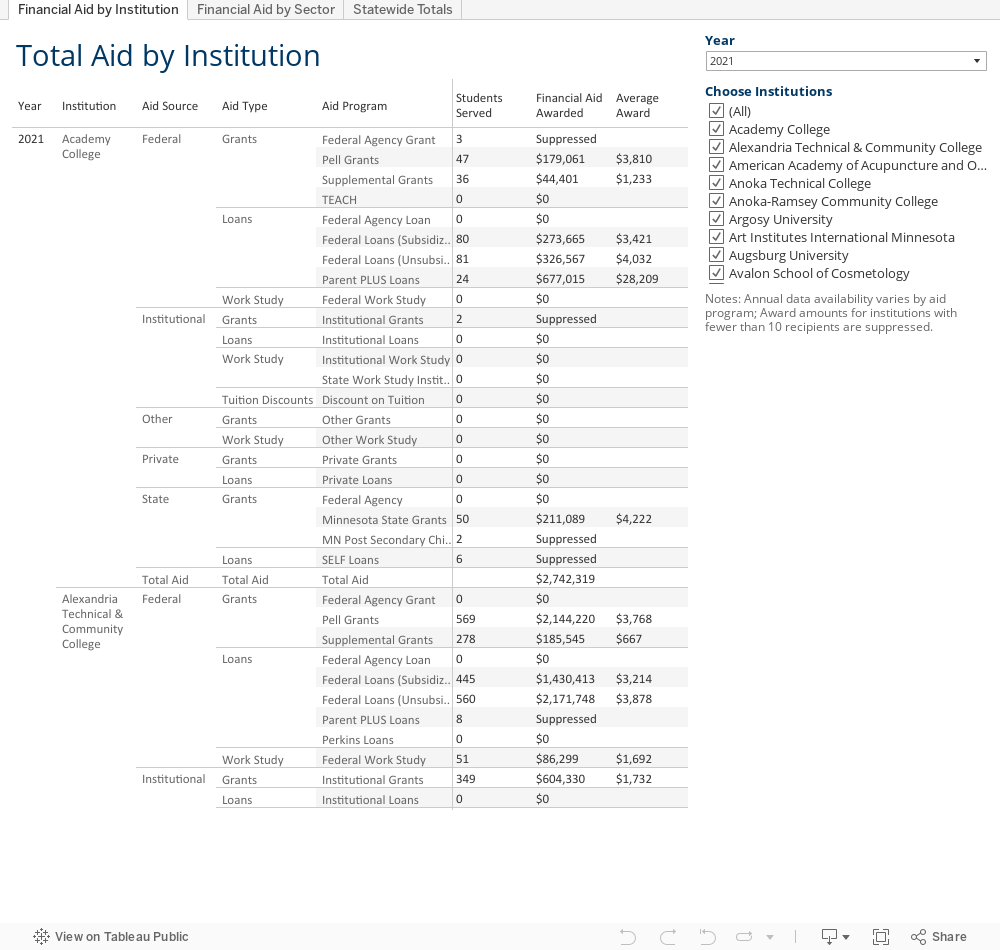
Financial aid data for each Minnesota postsecondary institution
Financial aid makes college affordable for many students. The amount and type of aid available to a student varies. Grants and scholarships lower the cost of college per student, while work study and loans allow students to pay for college by increasing current income or deferring payment to future income. The combination of types of aid and amounts available to an individual student may influence his or her decision to go to college, or which college he or she chooses.
Grants and loans make up most of the aid students receive
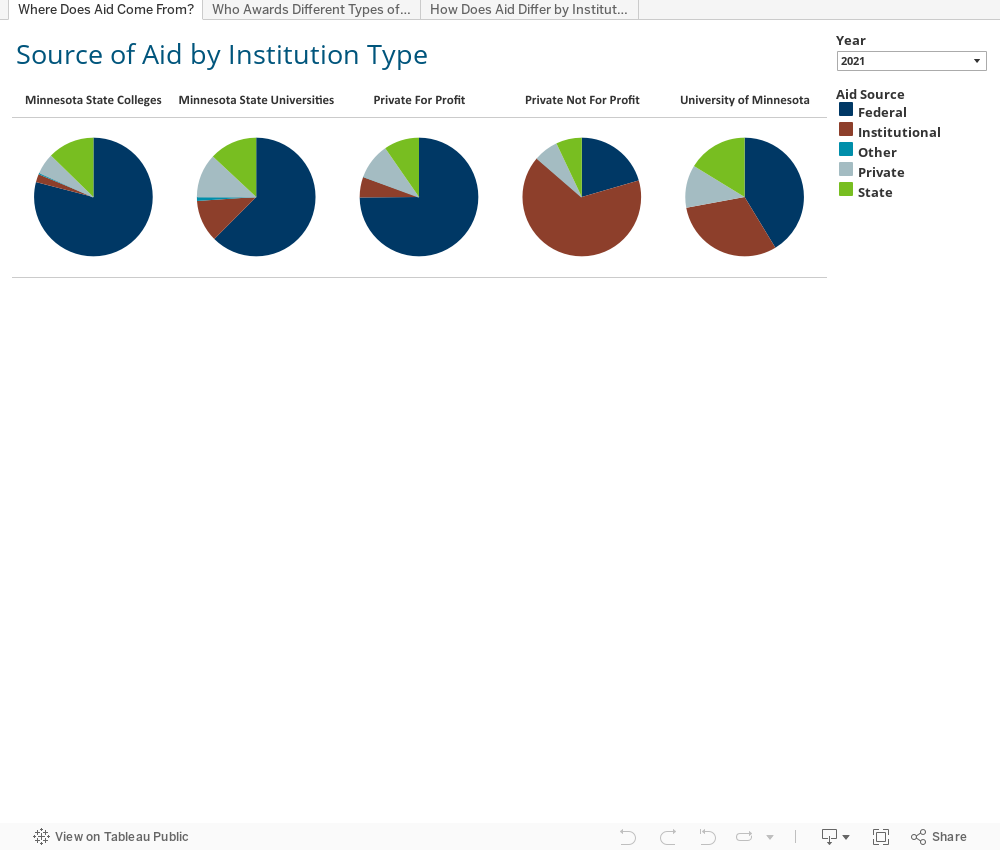
In 2019-2020, undergraduates enrolled in Minnesota institutions received roughly $2.8 billion in financial aid. In Minnesota, students are eligible to receive federal grants (such as the Pell grant), the Minnesota State Grant, other grants administered by the state (such as the Postsecondary Child Care Award), and grants from institutional and private sources. More than half of all aid students receive are grants, and the total amount of grants received varies by institution type.
Roughly one third of grants that these students received in 2019-2020 came from federal or state sources. Almost 60% of grants received were from institutions themselves. These grants are primarily offered at private non-profit institutions and the University of Minnesota. Aid in the form of grants (from all sources) totaled $1.6 billion in 2019-2020.
Download a .xls sheet of financial aid received in 2020-2021
Download a .pdf of financial aid received in 2020-2021
Most aid that students receive comes from federal sources
For most institutions, the primary source of aid is federal aid. Just under half of all aid received in 2019-2020 came from federal sources, totaling nearly $1.2 billion. Roughly 70% of federal aid awarded was in the form of loans. At Minnesota State Universities and private-for-profit institutions, more than half of all aid students received came in the form of loans. At Minnesota State Colleges and the University of Minnesota system, loans represented just under half of all aid received. However, for students at private non-profit institutions, institutional aid made up nearly two-thirds of aid awarded to students. Institutional aid is primarily offered as grants, and sometimes as direct tuition discounts.
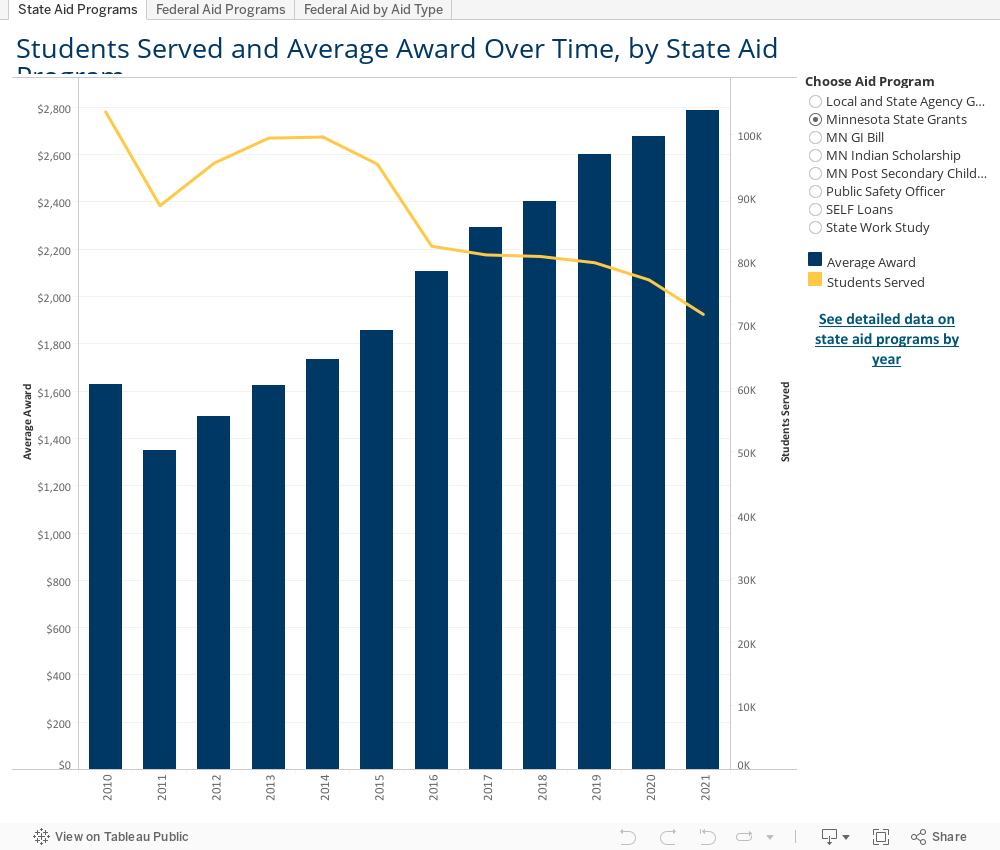
Historic trends in financial aid awarded
For most institutions, the primary source of aid is federal aid. Just under half of all aid received in 2019-2020 came from federal sources, totaling nearly $1.2 billion. Roughly 70% of federal aid awarded was in the form of loans. At Minnesota State Universities and private-for-profit institutions, more than half of all aid students received came in the form of loans. At Minnesota State Colleges and the University of Minnesota system, loans represented just under half of all aid received. However, for students at private non-profit institutions, institutional aid made up nearly two-thirds of aid awarded to students. Institutional aid is primarily offered as grants, and sometimes as direct tuition discounts.
| Source of Aid | |||||||||
|---|---|---|---|---|---|---|---|---|---|
| 2009 | 2011 | 2013 | 2015 | 2016 | 2017 | 2018 | 2019 | 2020 | |
| Federal Government | $1,653,086,861 | $2,206,712,012 | $2,047,586,989 | $1,763,444,285 | $1,547,737,707 | $1,396,278,361 | $1,370,423,980 | $1,275,430,474 | $1,205,467,099 |
| State of Minnesota | $307,773,684 | $387,428,358 | $279,183,419 | $275,265,745 | $283,085,008 | $270,750,405 | $270,531,262 | $289,650,382 | $280,406,970 |
| Postsecondary Institutions | $541,866,453 | $663,163,566 | $737,102,530 | $786,374,386 | $829,529,612 | $930,721,920 | $930,721,920 | $999,282,598 | $999,282,598 |
| Private and Other Sources | $260,504,758 | $240,384,582 | $239,687,859 | $239,519,421 | $242,547,720 | $250,394,647 | $250,394,647 | $268,603,195 | $259,219,971 |
| $2,124,279,612 | $2,763,231,756 | $3,397,688,518 | $3,303,560,796 | $3,064,603,837 | $2,902,900,047 | $2,822,071,809 | $2,822,071,809 | $2,790,264,769 | 2,744,376,638 |
| Type of Aid | |||||||||
| 2009 | 2011 | 2013 | 2015 | 2016 | 2017 | 2018 | 2019 | 2020 | |
| Grants from All Sources | $1,071,431,191 | $1,501,752,297 | $1,523,443,150 | $1,507,712,055 | $1,505,064,494 | $1,449,085,623 | 1,512,192,515 | $1,547,238,777 | $1,559,169,538 |
| Loans to Students | $1,535,387,297 | $1,689,031,977 | $1,592,550,278 | $1,383,568,392 | $1,226,733,841 | $1,112,061,798 | 1,086,662,436 | $993,652,375 | $944,715,969 |
| Loans to Parents | $118,704,439 | $161,056,571 | $139,959,733 | $134,682,764 | $133,671,947 | $121,258,582 | $123,949,866 | $119,547,756 | $110,790,169 |
| Student Earnings from Work Study Jobs | $37,708,832 | $45,847,673 | $47,607,185 | $38,640,626 | $37,429,765 | $34,100,298 | $35,818,521 | $59,474,737 | $56,455,838 |
| Total | $2,763,231,759 | $3,397,688,518 | $3,303,560,796 | $3,064,603,837 | $2,902,900,047 | $2,716,506,301 | $2,822,071,809 | $2,790,264,769 | $2,744,376,638 |
Source: Office of Higher Education, Financial Aid Awarded Survey
Federal Aid Awarded to Minnesota Undergraduates
| Program | 2009 | 2011 | 2013 | 2015 | 2016 | 2017 | 2018 | 2019 | 2020 |
|---|---|---|---|---|---|---|---|---|---|
| Federal Pell Grants | $263,967,345 | $512,664,048 | $481,335,035 | $410,508,355 | $363,780,632 | $332,494,158 | $346,439,425 | $344,242,795 |
$327,716,909 |
| Federal SEOG Grants | $20,622,242 | $21,197,558 | $20,926,183 | $19,346,264 | $19,058,427 | $18,664,998 | $18,573,957 | $19,808,867 |
$19,621,420 |
| Federal Academic Competitiveness Grants | $6,507,744 | $10,380,323 | $0 | $0 | $0 | $0 | $0 | $0 | $0 |
| Federal SMART Grants | $3,210,231 | $7,961,670 | $0 | $0 | $0 | $0 | $0 | $0 |
$0 |
| Other Federal Agency Grants | $6,698,234 | $21,776,982 | $18,501,528 | $7,719,386 | $6,361,439 | $6,386,597 | $4,845,004 | $7,452,683 |
$10,076,395 |
| Federal Stafford Subsidized Loans | $410,797,996 | $685,332,255 | $643,552,870 | $525,479,384 | $454,353,446 | $400,300,763 | $386,415,243 | $347,183,002 |
$316,449,938 |
| Federal Stafford Unsubsidized Loans | $477,385,787 | $742,323,243 | $692,966,605 | $616,096,314 | $524,764,200 | $478,962,428 | $450,372,145 | $415,234,673 | $398,518,503 |
| Federal Perkins Loans | $15,763,483 | $17,196,684 | $20,905,261 | $24,409,256 | $21,424,992 | $17,798,554 | $17,301,775 | $0 | $0 |
| Federal PLUS | $118,704,439 | $161,056,571 | $139,959,733 | $134,682,764 | $133,671,947 | $121,258,582 | $123,949,866 | $119,547,756 |
$110,790,169 |
| Other Federal Agency Loans | $633,304 | $574,045 | $2,052,121 | $1,771,529 | $1,266,480 | $583,431 | $816,374 | $648,488 |
$624,002 |
| Federal Work-Study | $20,156,879 | $26,248,633 | $27,387,653 | $23,431,033 | $23,056,144 | $19,828,850 | $21,710,191 | $21,285,949 |
$21,669,763 |
| Totals | $1,653,086,861 | $2,206,712,012 | $2,047,586,989 | $1,763,444,285 | $1,547,737,707 | $1,396,278,361 | $1,370,423,980 | $1,275,404,213 |
$1,205,467,099 |
Source: Office of Higher Education, Financial Aid Awarded Survey
| Program | 2009 | 2011 | 2013 | 2015 | 2016 | 2017 | 2018 | 2019 | 2020 |
|---|---|---|---|---|---|---|---|---|---|
| Federal Pell Grants | 98,691 | 153,295 | 151,399 | 122,841 | 107,874 | 98,088 | 97,946 | 93,997 |
88,526 |
| Federal SEOG Grants | 23,795 | 33,094 | 31,056 | 27,066 | 26,946 | 25,220 | 24,285 | 26,421 |
24,749 |
| Federal Academic Competitiveness Grants | 8,207 | 13,486 | 0 | 0 | 0 | 0 | 0 | 0 | 0 |
| Federal SMART Grants | 1,043 | 2,605 | 0 | 0 | 0 | 0 | 0 | 0 | 0 |
| Other Federal Agency Grants | 0 | 0 | 0 | 0 | 0 | 1,391 | 1,368 | 1,257 |
2,306 |
| Federal Stafford Subsidized Loans | 113,588 | 184,940 | 180,510 | 142,083 | 122,884 | 109,547 | 104,742 | 94,682 |
86,589 |
| Federal Stafford Unsubsidized Loans | 113,648 | 191,127 | 184,899 | 146,771 | 129,721 | 119,927 | 114,182 | 104,813 |
99,751 |
| Federal Perkins Loans | 11,900 | 9,447 | 10,167 | 11,521 | 9,259 | 7,899 | 7,801 | 0 | 0 |
| Federal PLUS | 13,238 | 16,226 | 14,598 | 11,900 | 11,522 | 10,181 | 10,172 | 9,370 |
8,296 |
| Other Federal Agency Loans | 0 | 0 | 0 | 0 | 0 | 181 | 247 | 188 |
181 |
| Federal Work-Study | 12,731 | 14,971 | 15,167 | 12,725 | 12,567 | 10,350 | 11,056 | 10,175 |
10,511 |
| Total Students | 305,730 | 327,724 | 392,447 | 619,191 | 587,796 | 474,907 | 420,773 | 382,784 |
371,799 |
Source: Office of Higher Education, Financial Aid Awarded Survey
Prior Reports
2020
- Full Report
[75 pgs; release date: August 2021]
2019
- Full Report
[122 pgs; release date: November 2020]
2018
- Full Report
[122 pgs; release date: November 2019]
2017
- Full Report
[104 pgs; release date: November 2019]
2016
- Full Report
[127 pgs; release date: July 2019]
2015
- Highlights of Financial Aid Awarded Survey, 2015
[19 pgs; release date: August 2016] - Full Report
[146 pgs; release date: August 2016]
2013
- Highlights of Financial Aid Awarded Survey, 2013
[19 pgs; release date: July 2014] - Full Report
[159 pgs; release date: July 2014]
2011
- Highlights of Financial Aid Awarded Survey, 2011
[22 pgs; release date: August 2012] - Full Report
[166 pgs; release date: August 2012]
2009
- Highlights of Financial Aid Awarded Survey, 2009
[20 pgs; release date: July 2010] - Full Report
[179 pgs; release date: July 2010]
2007
- Highlights of Financial Aid Awarded Survey, 2007
[14 pgs; release date: August 2008] - Full Report
[170 pgs; release date: August 2008]
2005
- Highlights of Financial Aid Awarded Survey, 2005
[15 pgs; release date: September 21, 2006] - Full Report
[161 pgs; release date: August 2006]
More Information
Related Pages
Quick Links
- Why College?
- Explore Your Interests & Careers
- Prepare at School
- Summer Academic Enrichment Program
- Earn College Credit in High School
- Recommended High School Classes & Graduation Requirements
- Advice for Students with Disabilities
- Succeed as an Adult Student
- Useful College Prep Resources
- Minnesota Goes to College!
- Get Ready Program Overview
- College Planning Presentation Information
- College Navigator Presentation Request Form
- Minnesota Indian Scholarship Program Outreach
- Competitive Grant Programs
- Dual Training Grant
- Public Engagement Calls
- "Life After Now" Podcast
- Certified Nursing Assistant Training
- Direct Admissions Minnesota
- Collecting Data from Minnesota Postsecondary Institutions
- Campus Financial Aid Administrator Resources
- Statewide Financial Aid Conference
- Campus Student Enrollment Reporting Resources
- Ordering Materials for Your Students
- Supplementing Your College Counseling
- Early Awareness Efforts
- Student Homelessness in Higher Education Resources
- Shared Library Resources
- MN FAFSA Tracker
- Campus Sexual Violence Prevention and Response
- Statewide FAFSA Filing Goal
- Financial Aid Estimator
- Online Applications
- About Financial Aid
- What Does College Cost?
- Tips for Lowering the Cost of Higher Education
- Institutional Payments
- Financial Aid You Don't Repay
- Financial Aid You Must Repay (Student Loans)
- Financial Aid You Earn
- Military Service Education Benefits
- Reduced Out-of-State Tuition Options
- Education Tax Benefits
- New Video Demystifies Paying for College
- Public Service Loan Forgiveness
- Useful Online Resources
- Ready, Set, FAFSA!
- Data Maps and Infographics
- Educational Attainment Goal 2025
- Minnesota Measures
- Minnesota P-20 Statewide Longitudinal Education Data System
- College Readiness & Participation Data
- Student Enrollment Data
- Degrees, Graduation Rates, Attainment & Outcomes
- Financial Aid Data & Trends
- Tuition & Fees Data
- Student Health and Safety
- Institution and Data Search
- Transfer Students
- Research Reports
- A-Z Data Table Index